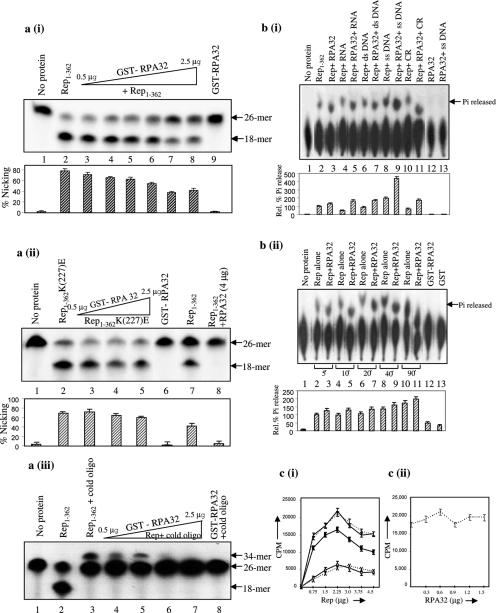
Figure 7.
Modulation of intrinsic biochemical activities of Rep by PsRPA32. (a) The autoradiogram of the 15% polyacrylamide-urea gel showing nicking and ligation activities. (i) The 5′ 32P-labelled 26mer oligonucleotide substrate (lane 1), cleaved product i.e. 18mer generated by ∼500 ng of Rep1–362 alone (lane 2) and in presence of increasing concentrations (0.5–2.5 μg) of PsRPA32 (lanes 3–7) respectively are shown. Labelled substrate incubated with purified RPA32 (lane 8) is shown as control. The bar graph shown below represents the percent nicking for each lane. Experiments were performed in triplicate and the error bars indicate SEMs. The data were obtained by densitometric scanning of each lane of Figure (a) (i). (ii) Experiments performed are similar to (i) except that the Rep1–362(K227E) mutant protein was used instead of Rep1–362 wild-type protein (lanes 2–5). The cleaved products of Rep1–362 wild-type and in presence of RPA32 are shown in lanes 7 and 8, respectively. The amount of the Rep1–362(K227E) protein used for nicking reaction was ∼500 ng; and 0.5–2.5 μg of RPA32 was used. Lane 6 represents the nicking activity of RPA32 alone. The bar graph shown below represents the percent nicking for each lane with error bars indicating SEMs of the three independent experiments. (iii) Ligation activity of Rep in presence of PsRPA32. The 5′ 32P-labelled substrate and cleaved product by Rep1–362 alone are shown in lanes 1 and 2, respectively. The Rep-mediated ligated product of 5′-32P-labelled oligonucleotide and the unlabelled 26mer oligonucleotide (lane 3) and in presence of increasing concentrations (0.5–2.5 μg) of PsRPA32 (lanes 4–7) are shown. (b) Autoradiogram showing the ATPase activity of Rep with or without RPA32 protein. (i) Autoradiogram shows the ATP hydrolysing activity of Rep1–362 to release free phosphate (Pi) from ATP (lane 2), in presence of different modulators like RNA (lane 4), ds DNA (lane 6), ssDNA (lane 8) and CR (lane 10). The intrinsic ATPase activity of Rep in presence of RPA32 kDa protein and different modulators are shown in lanes 3, 5, 7, 9 and 11. The ATPase activity of PsRPA32 protein, without or with ssDNA is shown in lanes 12 and 13 as control. Densitometric scanning quantitated the amount of Pi released. Bar graph below represents the percent Pi released for each lane with error bars indicating SEMs of three independent experiments. Percent Pi released by Rep was arbitrarily assigned as 100% and other values were relative to this scale. Lane 1 represents control without any protein. (ii) Time course kinetics of intrinsic ATPase activity of Rep1–362 in presence or absence of RPA32 after 5, 10, 20, 40 and 90 min time intervals of incubation (lanes 2–11). The percent Pi release for each lane is shown in bar diagram below. The error bars for each lane indicate SEMs. Lanes 1, 12 and 13 represent control without any protein, with RPA32 and with GST respectively. (c) Panel (i) represents the DNA-binding ability of increasing concentrations of Rep1–362 (0.75–4.5 μg) to common region (CR) without or with ∼1 μg of RPA32 [— for Rep, ----- for Rep + ∼ 1 μg RPA32], in presence of 10 ng unlabelled CR (10× specific competitor) [ Rep, ----X--- - Rep +1 μg RPA32] and in presence of non-specific DNA molecule [50× non-specific competitor,
  ]. The DNA-binding of 1.5 μg of Rep in presence of increasing concentrations of RPA32 (0.3–1.5 μg) is shown in panel (ii). Error bars indicate SEMs.

