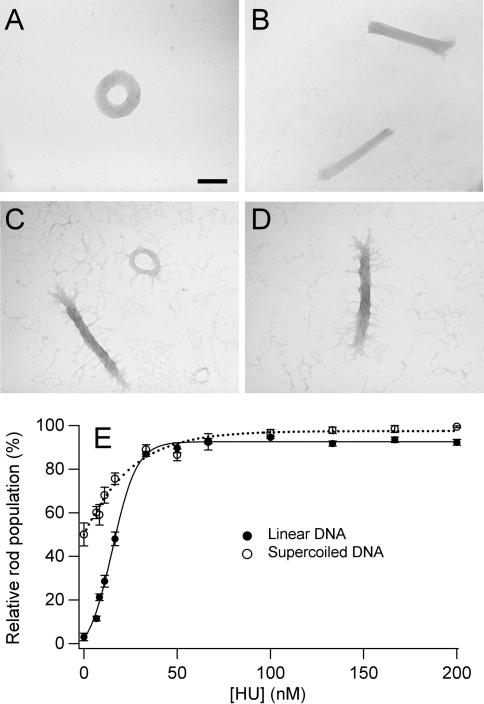
Figure 2.
Spermidine-induced DNA condensate morphologies and morphology statistics as a function of HU concentration. (A) TEM image of a representative condensate of linear DNA condensed by spermidine (no HU present). (B) TEM image of representative condensates produced under identical conditions as in A, except in the presence of 50 nM HU. (C) TEM image of representative condensates of supercoiled DNA condensed by spermidine (no HU present). (D) TEM image of representative condensates produced under identical conditions as in C, except in the presence of 50 nM HU. Scale bar is 100 nm. (E) Relative rod populations versus HU concentration for linear and supercoiled DNA condensed by spermidine. Samples were 5 µM DNA bp, 700 µM spermidine chloride, 0.33 × TE (pH 7.8), 15 mM NaCl, and indicated concentrations of HU dimer.

