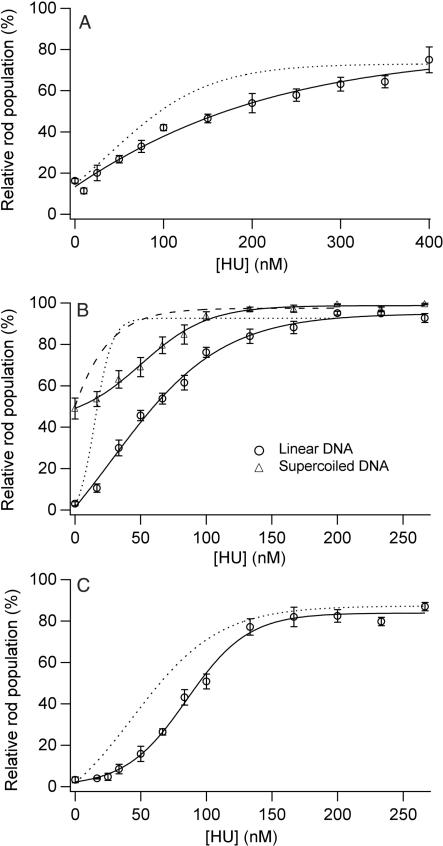
Figure 4.
Condensate morphology statistics versus HU concentration for reactions with HU added to DNA before condensation. (A) Relative rod populations versus HU concentration for linear DNA condensed by PEG. Samples were 5 µM DNA bp, 125 mg/ml PEG 8000, 100 mM NaCl, 50 mM Tris-HCl, 1 mM EDTA (pH 7.8), and indicated concentration of HU dimer. (B) Relative rod populations versus HU concentration for linear (circle) and supercoiled DNA (triangle) condensed by spermidine. Samples were 5 µM DNA bp, 700 µM spermidine chloride, 0.33 × TE (pH 7.8), 15 mM NaCl and indicated concentrations of HU dimer. (C) Relative rod populations versus HU concentration for linear DNA condensed by spermine. Samples were 5 µM DNA bp, 15 µM spermine chloride, 0.33 × TE (pH 7.8), 15 mM NaCl and indicated concentrations of HU dimer. Dashed curves are best-fit curves from rod populations measured for corresponding experiments in which HU was added coincident with the condensing agent (see Figures 1–3 for details).

