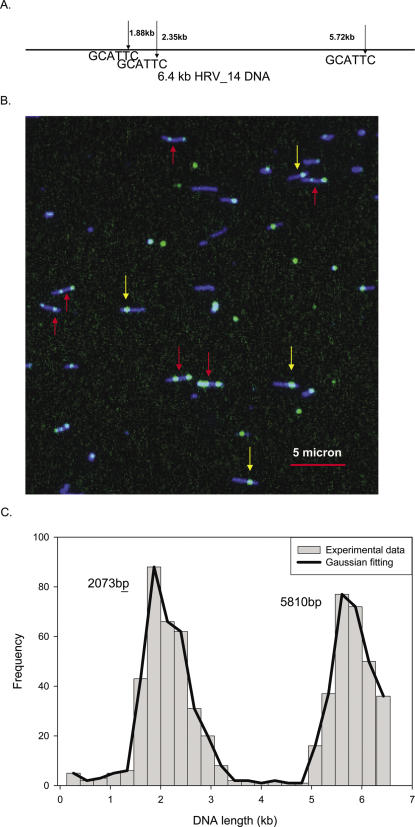
Figure 6.
Sequence motif map of human rhinovirus 14 DNA. (A) The predicted Nb.Bsm I (GCATTC) map of human rhinovirus 14 DNA. Only two sites are present in this small RNA virus. (B) In the large field of the intensity scaled composite image, numerous molecules are found. Some molecules have two green labels (red arrows) and some have only one green label (yellow arrows). (C) The sequence motif map in the graph was obtained by analyzing 56 single molecule fluorescence images. The solid line is the Gaussian curve fitting and the peaks correspond well to the predicted locations of the sequence motif.

