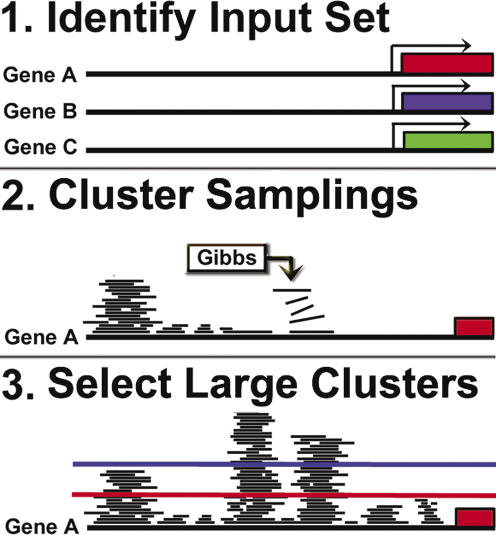
Figure 1.
Schematic diagrams of the positional clustering process. (1) Sets of putatively co-regulated genes are identified. (2) Gibbs sampling is iterated on the input set thousands of times across numerous motif widths. Results are clustered on promoter position, creating a per-nucleotide frequency of the long term recurrence of Gibbs sampling. (3) A linear threshold is used to isolate the most frequently recurring positions, discarding all positions which fall below the threshold.

