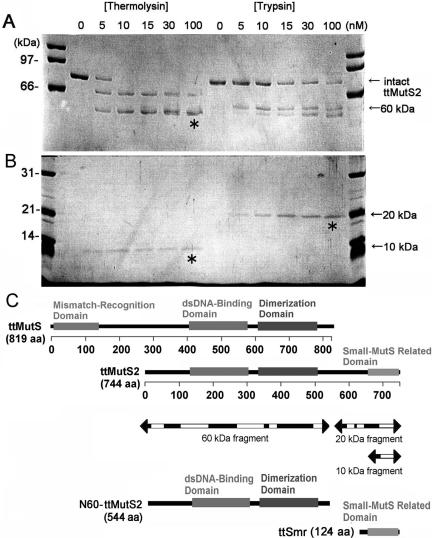
Figure 1.
Limited proteolysis of ttMutS2. (A) An aliquot of 4 μM ttMutS2 was reacted with thermolysin or trypsin as described in Materials and Methods. The concentrations of protease are indicated at the top of the figure. For the thermolysin digestion, the reaction mixtures contained 10 mM CaCl2. The digests were separated by 7.5% SDS–PAGE. Arrows indicate the bands derived from digestions. (B) The same samples were also separated by 12.5% SDS–PAGE. (C) Schematic representation of ttMutS, ttMutS2 and the fragmentation of ttMutS2. Regions represented as mismatch-recognition, dsDNA-binding and dimerization domains in ttMutS are the counterparts of T.aquaticus MutS whose crystal structure has been solved (24). The dsDNA-binding and ATPase domains of ttMutS2 show >30% identity in the respective domains of ttMutS. Three bands indicated by asterisks in A and B were manually excised and subjected to PMF analysis. Arrows indicate the fragmentation of ttMutS2, and the white regions were detected by PMF analysis.

