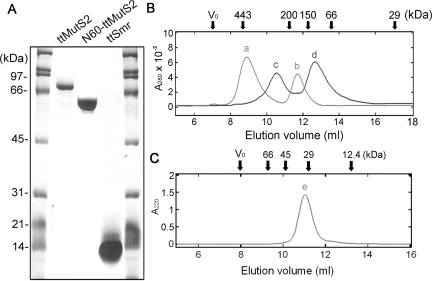
Figure 2.
Size exclusion chromatography. (A) Recombinant proteins were purified as described in Materials and Methods and subjected to 12% SDS–PAGE. The calculated molecular mass of ttMutS2, N60-ttMutS2 and ttSmr were 82.5, 60 and 15 kDa, respectively. (B) The elution profiles of 4 μM ttMutS2 (light gray line) and 4 μM N60-ttMutS2 (black line). (C) The elution profile of 20 μM ttSmr. The elution positions for some of the size markers are shown at the top of the figure. Vo indicates the void volume of the column. The apparent molecular mass of peaks a, b, c, d and e were 410, 170, 290, 120 and 31 kDa, respectively.

