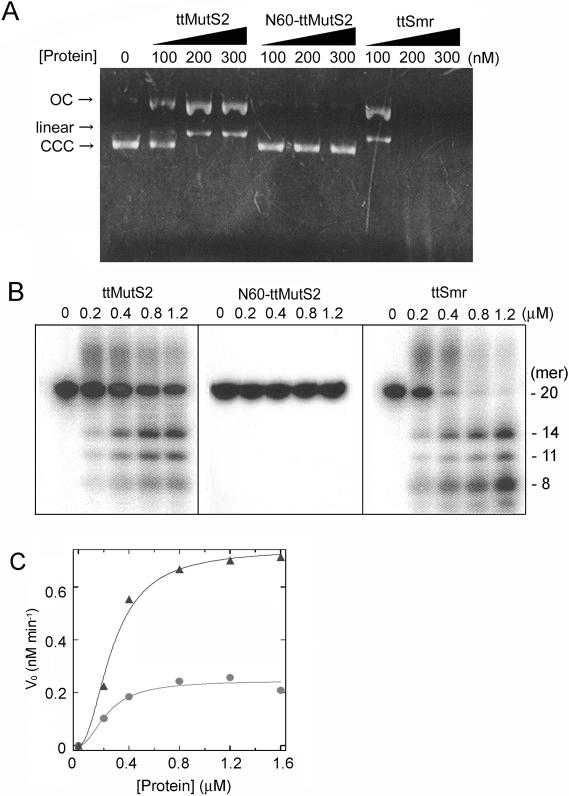
Figure 6.
Nuclease activity. (A) Nuclease activities of the proteins were examined using plasmid DNA as substrate. Reaction mixtures were subjected to 0.7% agarose gel electrophoresis and stained with ethidium bromide. Arrows CCC, OC and Linear indicate the closed circular form, open circular form of the plasmid and linear dsDNA, respectively. (B) Nuclease activities of the proteins were examined using an oligonucleotide. The sizes of the digested DNA molecules were estimated referring to our previous result (23) and shown at the right of the panel. (C) The substrates were incubated with various concentrations of ttMutS2 or ttSmr under the same condition as (B) for 20 min. Initial rates (vo) were calculated on the basis of the proportion of all products to unreacted substrates, and plotted against protein concentration. The theoretical curve was drawn by fitting the data to Equation 1 (See Materials and Methods). Circles: ttMutS2; triangles: ttSmr.

