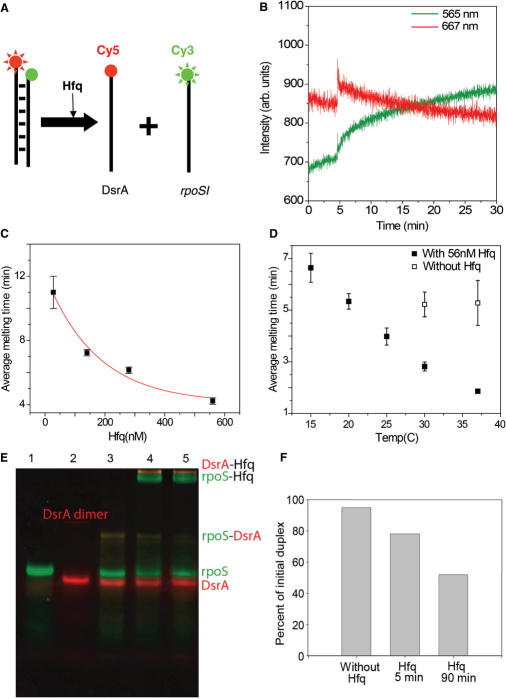
Figure 3.
Unwinding of DsrA+rpoS complex. (A) Schematic representation of rpoSI+DsrA melting by Hfq. (B) 25 nM rpoSI+DsrA complex was prepared in T50 buffer. The graph shows the intensity time traces of Cy3 at 565 nm (green line) and Cy5 at 667 nm (red lines). Hfq (28 nM) was added at 5 min. Increase in intensities of both dyes is followed by gradual decrease in FRET (average melting time = 11 min). (C) Average melting time as a function of Hfq concentration is plotted and fitted to an exponential decay function (red line). The fit decays to a value of 4.1 min for saturating concentrations of Hfq. (D) Average melting time as function of temperature in the presence of 56 nM Hfq (solid squares) and in the absence of Hfq (hollow squares) (E) An EMSA experiment that shows the melting reaction. Green and red bands correspond to the fluorescence scans with Cy3 and Cy5 filters respectively. Lane 1: Cy3-rpoSI (25 nM); Lane 2: Cy5-DsrA; Lane 3: Thermally annealed DsrA+rpoSI (25 nM); Lane 4–5: DsrA+rpoSI with 28 nM Hfq after 5 and 90 min. (F) The amount of Cy3-RNA in the annealed form is quantified and shown as a bar graph.

