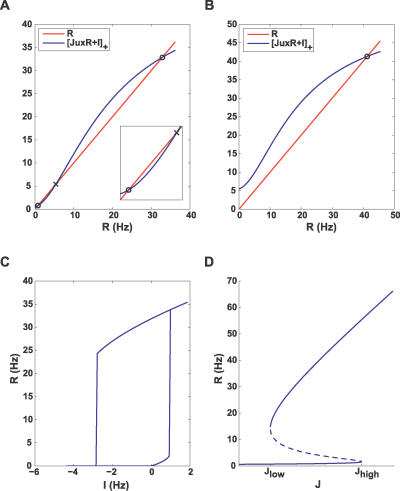
Figure 3. Steady State Analysis.
(A,B) Steady state values of the firing rate shown as intersection points (circle, stable; cross, unstable) between the decay and recurrent excitation terms in Equation 2, for low, 0.5 Hz (A), and high, 5.5 Hz (B) external current.
(C) Hysteresis plot showing stable steady states for different values of input.
(D) Bifurcation diagram for I = 0.5 Hz, illustrating the steady states for different values of connection strength. The dashed line marks unstable equilibria. All subplots use parameter set A (see Methods, Table 2).

