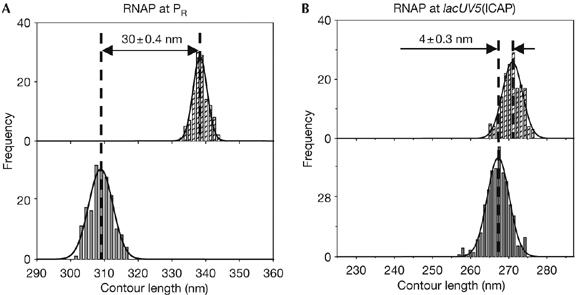
Figure 2.

The extent of DNA compaction depends on the sequence of the promoter. (A,B) Contour length distributions of DNA in the absence (hatched bars; top) and presence (grey bars; bottom) of RNAP are shown. Apparent DNA compaction is presented as mean±s.e.m. RNAP, RNA polymerase.
