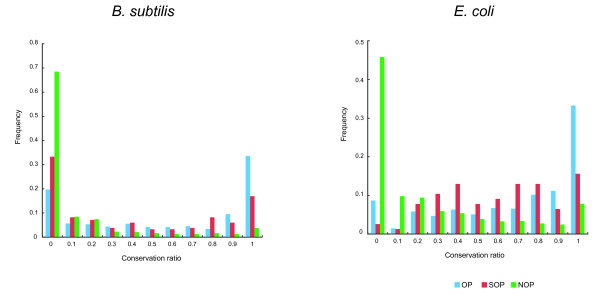
Figure 3.

Conservation of adajcent gene pairs across genomes. The left figure indicates the conservation ratio based on the gene pairs from B. subtilis, and the right figure is from E. coli. The ratios of adjacently conserved gene pairs for OPs, SOPs and NOPs are shown in blue, red and green, respectively.
