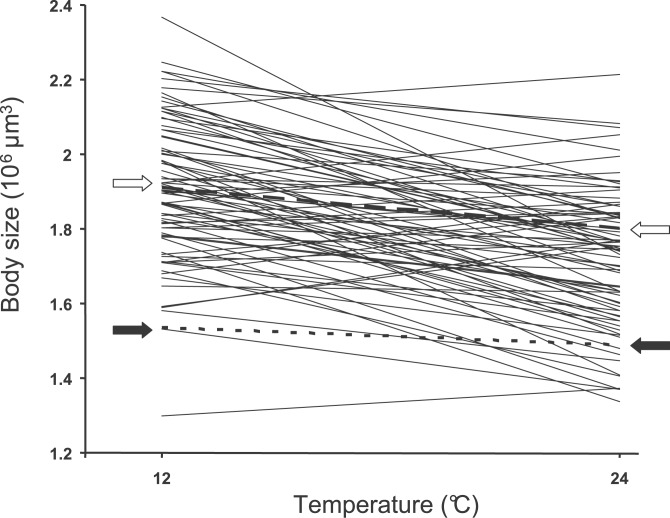
Figure 1. Slope of TRB for 80 RILs and Parental Strains.
We calculated the slope (106 μm3/degree) from a plot of body size versus temperature (12 °C and 24 °C) where: slope = (size at 24 °C − size at 12 °C)/(12 °C − 24 °C). The variance of body size calculated for all the RILs was small and differed only 7% between 12 °C and 24 °C. Most of the lines had a negative slope meaning that at low temperatures individuals grew bigger. Yet 17.5% of the RILs had a positive slope, and a few RILs were nearly nonplastic (i.e., slopes were relatively small). At 12 °C N2 was 35% larger than CB. The TRB for parental strains are designated by arrows: N2, open arrow; CB, solid arrow.

