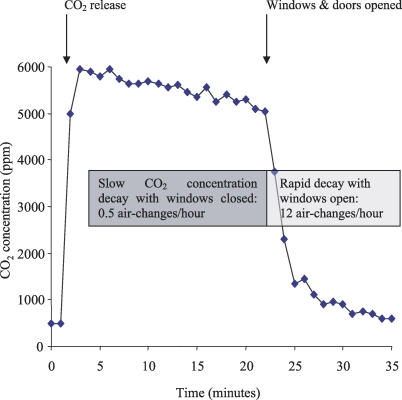
Figure 1. Measurement of Ventilation.
Illustrative carbon dioxide (CO2) concentration-decay experiment demonstrating a rapid rise in CO2 concentration during initial release to a peak of 6,000 parts/million (ppm) followed by slow decay calculated as 0.5 ACH until the windows and doors were opened. After windows and doors were opened, CO2 concentrations fell rapidly, indicating a calculated ventilation rate of 12 ACH. Repeated experiments of this type defined the effect of architectural and environmental variables on natural ventilation.

