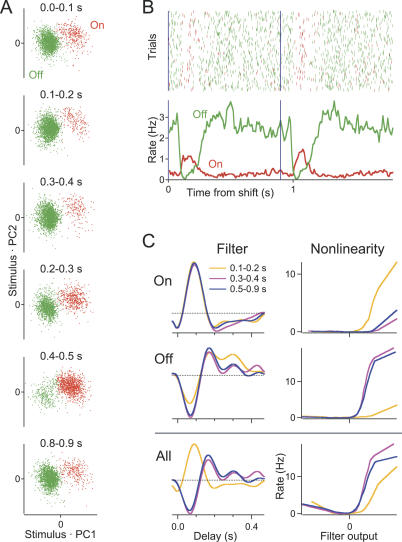
Figure 5. A Peripheral Shift Modulates On and Off Pathways in Opposite Directions.
(A) The spike-triggered stimuli of a sample ganglion cell, projected onto the first two principal components (PC1 and PC2), as in Figure 4B. Each plot uses spikes from a different time interval relative to the peripheral shift. In all cases, one finds two clusters of stimulus waveforms: one On-type and one Off-type.
(B) A raster graph of this cell's firing, displayed as in Figure 1D, but with On spikes and Off spikes indicated separately. Bottom: average firing rate derived from the On and Off pathways.
(C) Top: the 2LN model derived from spikes in three different time intervals: 0.1–0.2 s, 0.3–0.4 s, and 0.5–0.9 s. Linear filter and nonlinearity were computed separately from the On spikes and Off spikes as identified by the cluster plot (Figure 5A). Bottom: the single-pathway LN model computed from all spikes. Note the U-shaped nonlinearity to account for both On and Off spikes, as well as the polarity reversal of the filter shortly after the shift.

