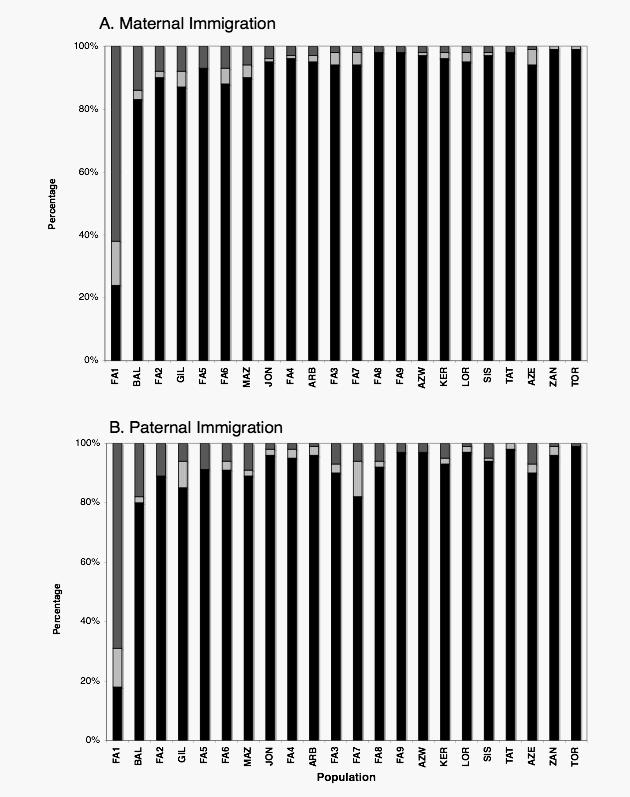
Fig. 2.

Demographic data.
Percentage of a) female and b) male immigrants per population. Dark grey: individuals with immigrant parents, Light grey: individuals with immigrant grandparents, Black: individuals with both parents and grandparents born locally. Population order corresponds to the decreasing percentage of individuals with immigrant mothers (a). Order of populations in b) is the same as for a) to allow direct comparison.
