
Fig. 1.
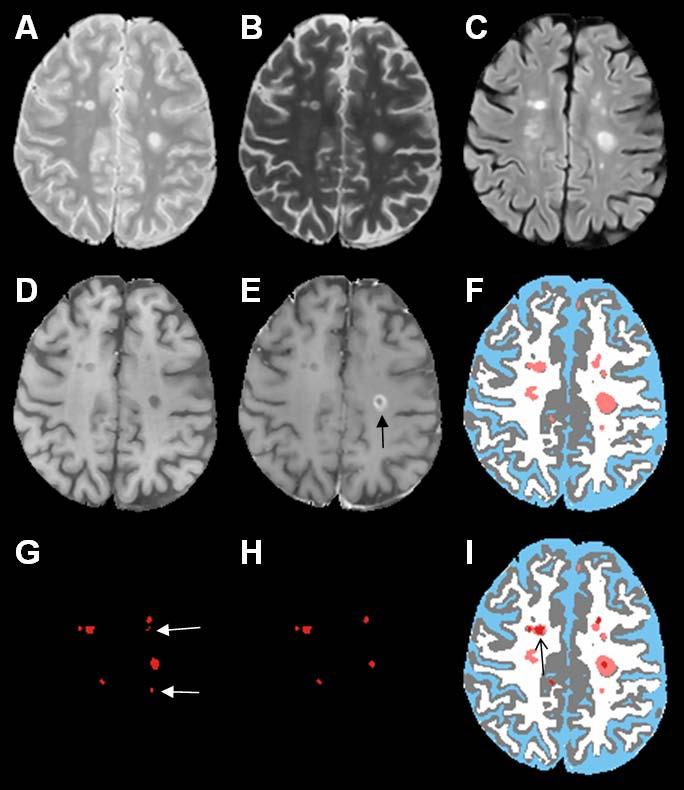
(A) PD, (B) T2, (C) FLAIR, (D) T1 precontrast, (E) T1 postcontrast, (F) segmented images, (CSF (blue), gray matter (gray), white matter (white), lesions (salmon)), (G) thresholded binary map of regional minima corresponding to black holes, (H) image with regional minima after false positives minimization (false positives as shown by white arrows in G were eliminated after masking G with the orthogonal image). The enhancement as shown by black arrow on image E was eliminated after differentiating enhancing lesions from black holes on T1 postcontrast image. Black holes are shown in red on final segmented image I. The effect of fuzzy delineation on the black hole is indicated by the black arrow on image I.