
Fig. 3.
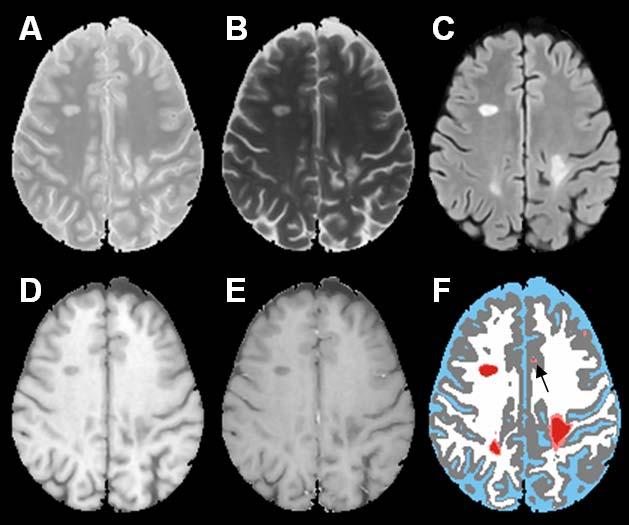
PD (A), T2 (B), FLAIR (C), T1 precontrast (D), T1 postcontrast (E), segmented image (F). The color scheme in the segmented image is CSF (blue), gray matter (gray), white matter (white), lesions (salmon), black holes (red). The falsely classified black hole is shown by the arrow.