
Figure 1.
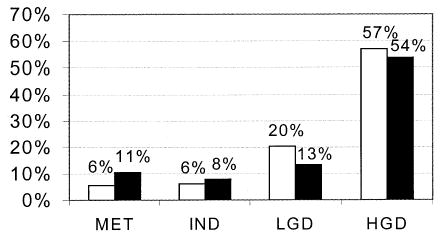
Percentage of patients with 17p (p53) LOH and flow cytometric abnormalities (increased 4N, aneuploidy) as a function of histological grade of dysplasia in Barrett’s esophagus. The y axis represents percent of patients, and the x axis represents histological grade. HGD = high-grade dysplasia; IND = indefinite for dysplasia; LGD = low-grade dysplasia; MET = metaplasia negative for dysplasia; □ = 17p (p53) LOH; ▪ = increased 4N or aneuploidy.