8.
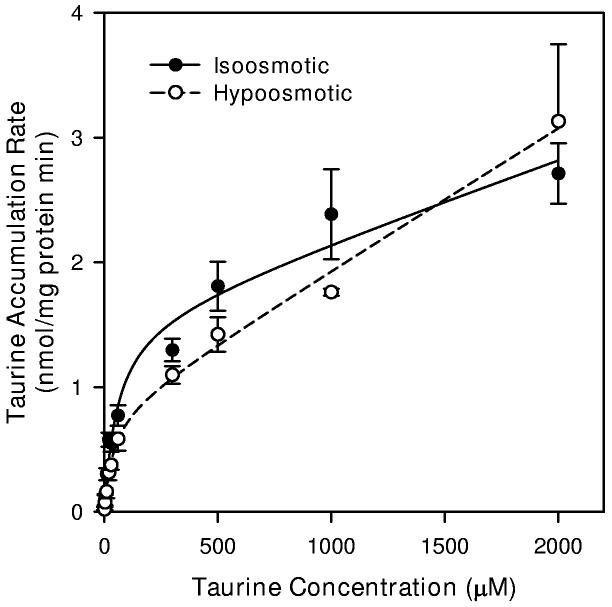
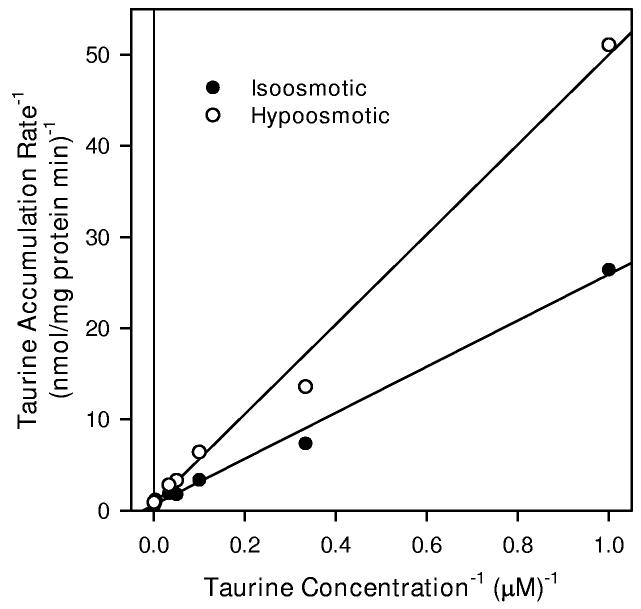
Taurine transport kinetics of hippocampal neuron cultures in isoosmotic and hypoosmotic conditions. (A) Cells were exposed to the indicated concentration of taurine plus tracer quantities of [3H]-taurine in isoosmotic or hypoosmotic PBS for 20 min before sampling to determine cellular taurine accumulation. Smooth lines are drawn according to the best fit non-linear regression to the sum of saturable plus non-saturable components of taurine accumulation using parameters given in Table 1 as described in the text. Data points are the mean ± SEM of 3-4 independent measurements. Error bars are not shown if they are smaller than the graph symbol. (B) Double reciprocal plots of the mean values at each taurine concentration following subtraction of the calculated non-saturable component. Straight lines represent the best fit linear regression analyses of the resulting data points (Isoosmotic r2 = 0.994, Hypoosmotic r2 = 0.993).


