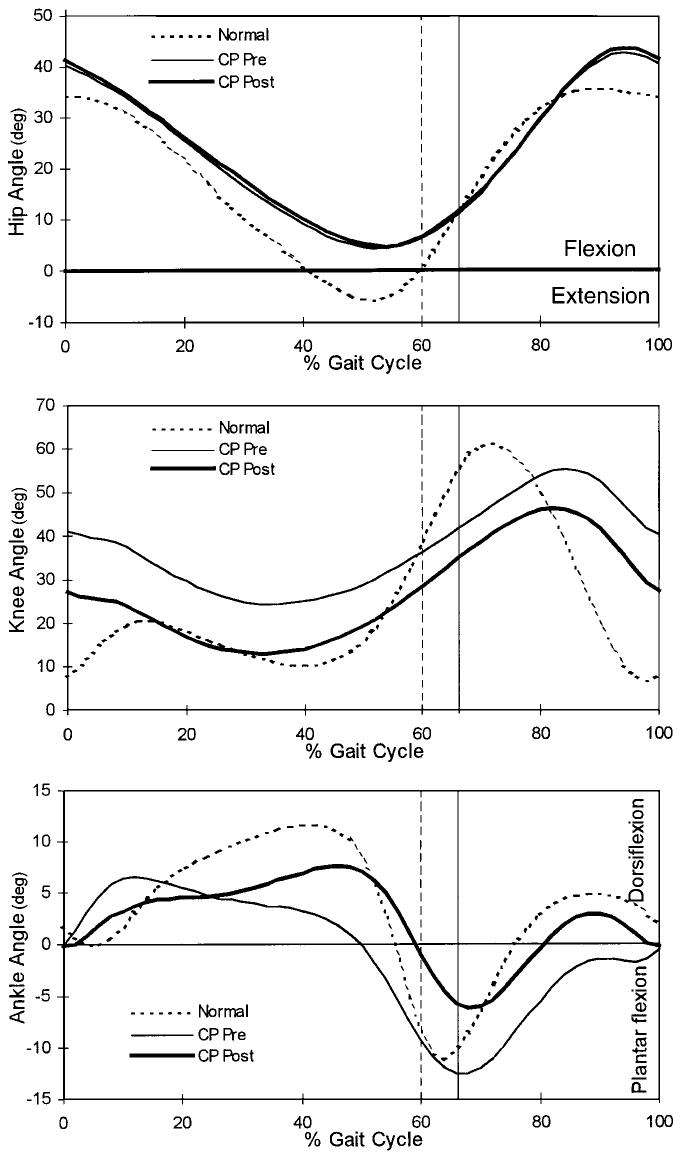
Fig. 1.
Gait profiles showing the mean hip, knee, and ankle angles for the normally developing subjects (dotted line), the patients with spastic cerebral palsy (CP) before muscle-tendon lengthening (thin line), and the patients with spastic cerebral palsy after muscle-tendon lengthening (heavy line). The vertical lines represent the time of toe-off for the normally developing subjects (dashed line) and for the patients who had spastic cerebral palsy (solid line).

