
FIGURE 7. Analysis of Src reduction on CLIC-5b expression and acidification of vesicles from in vitro differentiated osteoclasts.
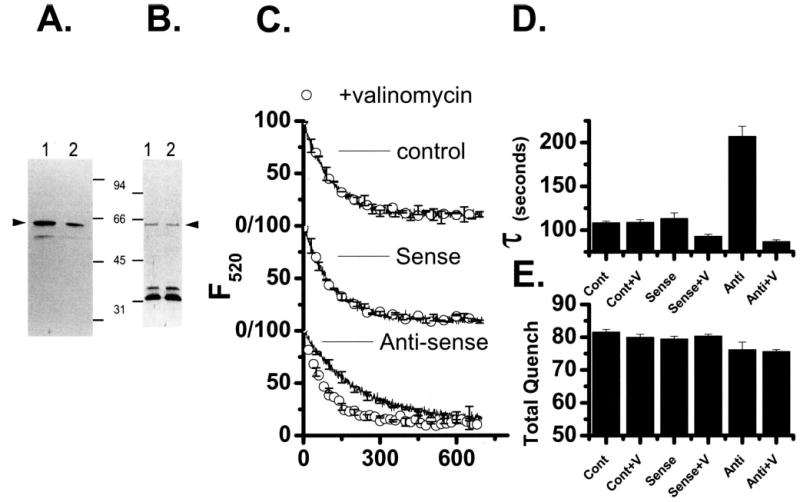
A, equal amounts of total cell protein from osteoclasts treated with sense (lane 1) or antisense (lane 2) Src phosphorothioate oligonucleotides were separated by SDS-PAGE, blotted and probed with avian Src antibodies. The integrated intensity was decreased by 65% in cells exposed to antisense Src oligonucleotide. B, equal amounts of membrane proteins from osteoclasts treated with sense (lane 1) or antisense (lane 2). Src oligonucleotides were separated by SDS-PAGE, blotted and probed with AP656 (15). The integrated intensity of the CLIC-5b band was unchanged (100 ± 1%) by sense or antisense oligonucleotide treatment. Molecular mass markers of 94, 66, 45, and 31 kDa are indicated. Arrowheads indicate the migration position of intact Src (A) and CLIC-5b (B). C, comparison of acidification by membrane vesicles prepared from cells treated with streptolysin-O in the absence of Src oligonucleotide (top), cells treated with sense oligonucleotide (center) or cells treated with antisense oligonucleotide (bottom). Each figure compares acidification (line) with acidification in the presence of 1 μM valinomycin (○). In addition to the data shown, acidification by each preparation was completely inhibited by bafilomycin A1 and displayed valinomycin-reversed inhibition by substitution of sulfate for chloride as in Fig. 1. For each preparation the acidification-dependent quenching was verified to be reversible by the addition of NH4Cl (3, 15). The data were analyzed by curve fitting as described under “Materials and Methods” to determine the time constant of acidification (τ) and extent of acidification-dependent quenching (Total Quench). The antisense suppression was studied in three independent experiments using parallel control and sense treatments in every case. Each oligonucleotide treatment (control, sense, and antisense) was done in triplicate, and the cell membrane vesicles prepared and analyzed independently. The acidification curves shown are the average of the replicates for one representative experiment (n = 3) with the standard deviation presented for every 50th point. D, comparison of the time constants, τ, for vesicle preparations from cells treated as follows: control cells, Cont; control cells and added valinomycin, Cont+V; sense oligonucleotide-treated cells, Sense; sense oligonucleotide-treated cells and added valinomycin, Sense+V; antisense oligonucleotide-treated cells, Anti; and antisense oligonucleotide-treated cells and added valinomycin, Anti-V. Each oligonucleotide treatment was done in triplicate, and the cell membrane vesicles prepared and analyzed independently (n = 3). The columns are the average of those three determinations and the error bars are the S.D., n = 3. E, total quench, for vesicle preparations, which are labeled as in B. D and E summarize our total results from three independent experiments where each oligonucleotide treatment was done in triplicate. Each column is the average of the successful replicates from the three experiments and the error bars are the S.D. for n = 3–9 but never less than 3.