
FIGURE 8. Immunohistochemistry of CLIC-5b and H+-ATPase in osteoclasts and the effect of Src suppression.
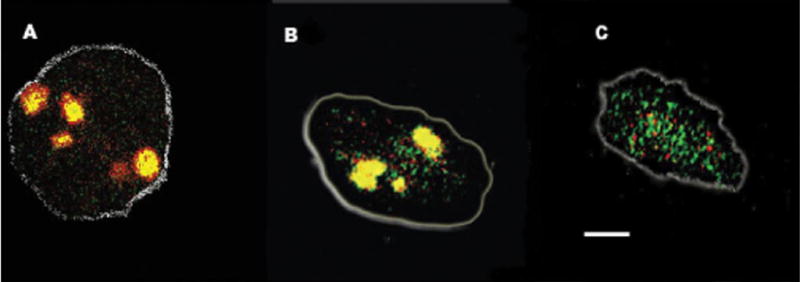
Osteoclasts were differentiated on coverslips and stained for CLIC-5b (green) and H+-ATPase (red ) as described. These panels are single osteoclasts recorded by confocal microscopy and processed as described under “Materials and Methods.” We processed five cells from each group (no nucleotide, sense, and antisense). The no nucleotide and sense cells were identical in appearance by this measure. The white bar in B is 10 microns, and the two panels have comparable magnification. The gray outline approximates the attachment border of the cells to the coverslip. Panel A, cells treated without nucleotide. Panel B, cells treated with sense nucleotide. Panel C, cells treated with antisense nucleotide.