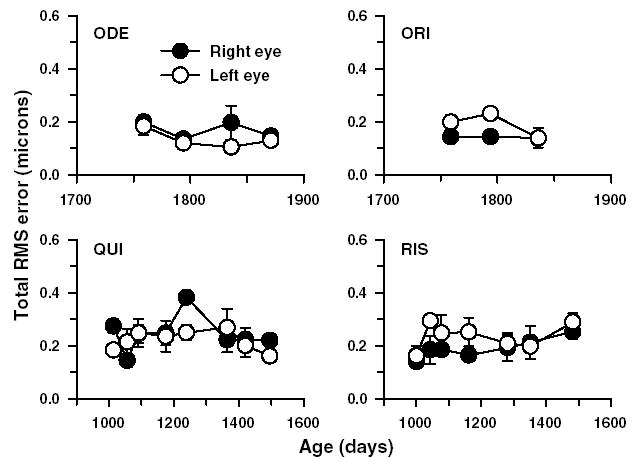
Fig. 1.

The total RMS error (3rd to 10th order) plotted as a function of age for four adolescent monkeys. Each data point represents the mean ± 1SD (n = 5). Data from both the right (●) and left eyes (○) are shown separately. Analyzed pupil diameter for all eyes was 5 mm.
