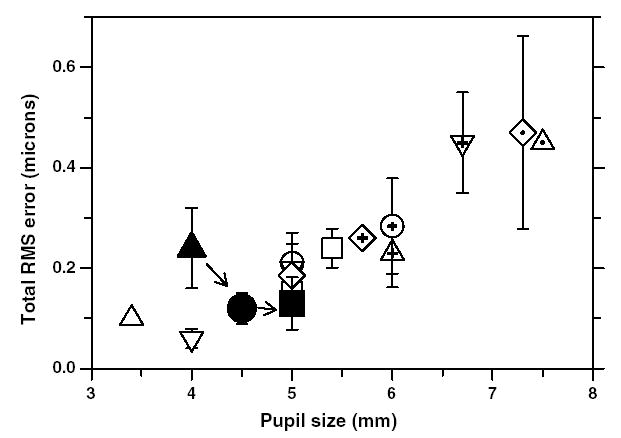
Fig. 10.

Comparison of total ocular wavefront aberrations between monkeys and humans. The data for monkeys in this study are shown as filled symbols. The filled triangle is the average RMS wavefront error for the 97 eyes at 23 days of age, the filled circle is the average RMS error at 200 days of age for five monkeys that were followed longitudinally and the filled square represent the average RMS error for six adolescent monkeys with mean age of 4.2 years. Error bars are ±1SD. Note that the aberrations are scaled to have a constant numerical aperture. Aberrations decrease with age in monkeys during emmetropization; however, they remain constant after about 200 days of age. The aberration data for humans are shown as open symbols (○, Iglesias et al., 1998;
 , Navarro et al., 1998; □, Liang et al., 1994;
 , ▵, Liang and Williams, 1997; ⬡, Walsh et al., 1984; ▽,
 , Calver et al., 1999;
 , Porter et al., 2001;
 , Cheng et al., 2003;
 , Paquin et al., 2002; ⋄, Carkeet et al., 2002;
 , Thibos et al., 2002a, 2002b, 2002c).
