
Figure 1.
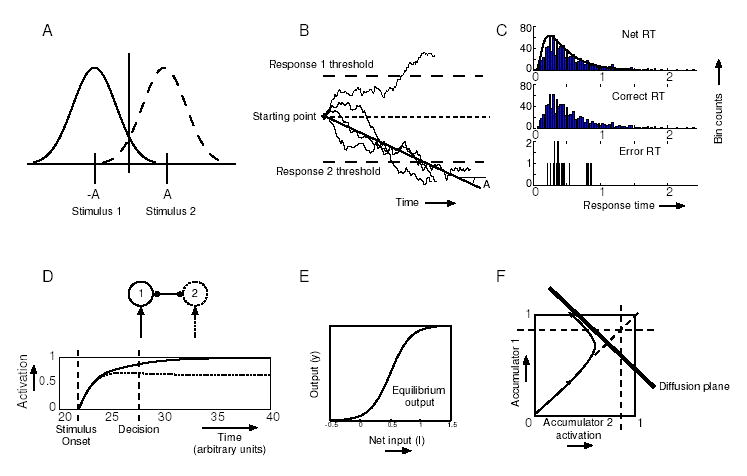
A: The two stimulus distributions; B: Sample paths of a drift-diffusion process; C: Long-tailed analytical RT density (solid curve) and simulated RT histogram (top), correct RT histogram (middle), error RT histogram (bottom); D: Time courses of noise-free, mutually inhibitory evidence accumulation units with sigmoid activation functions; E: The sigmoid activation function; F: A smoothed sample path of mutually inhibitory accumulator activations in the (y1, y2)-phase space showing rapid attraction to a line (the ‘diffusion plane’) followed by drift and diffusion in its neighborhood.