
Figure 4.
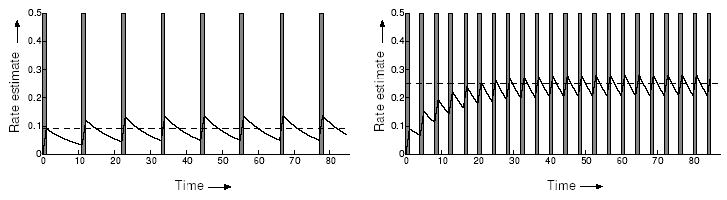
Reward rate estimate r(t) (sawtooth curve) in response to a sequence of short reward pulses s(t) (gray rectangles). Here the rewards are pulses of height 1 and width 1. In both cases the estimated reward rate oscillates around its true frequency, shown by the dotted line. Left panel: slow pulse rate; Right panel: fast pulse rate.