Fig 3.

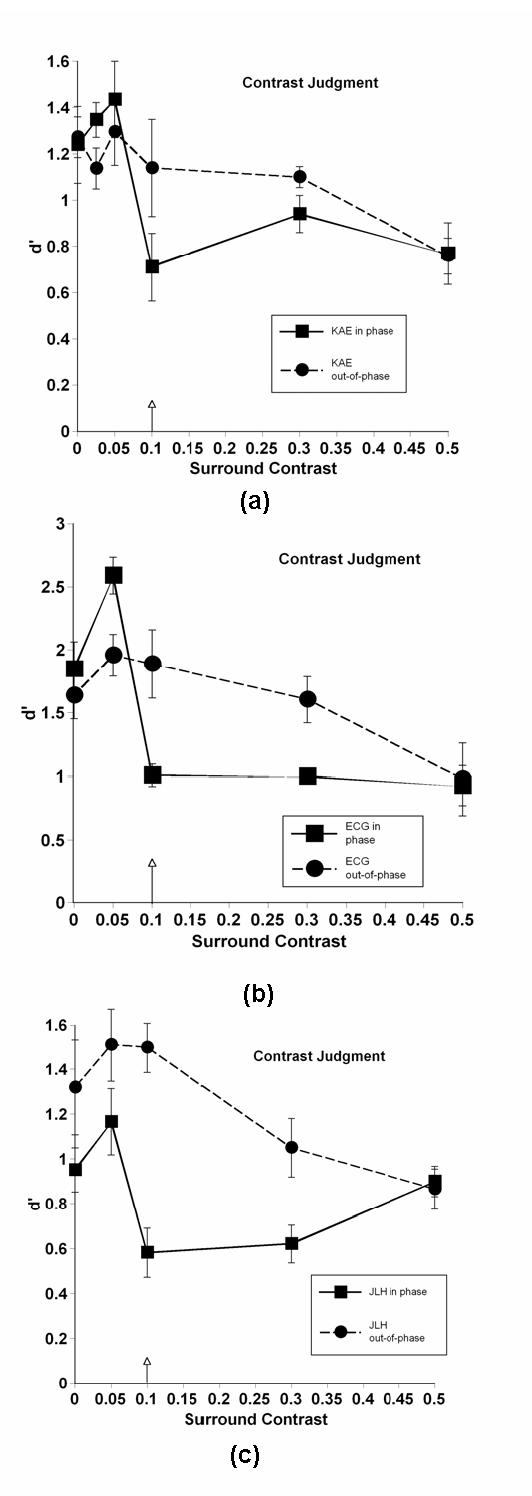
Contrast discrimination performance as a function of surround contrast. Arrow indicates the fixed 0.1 test contrast level (mean contrast for contrast discriminations). Different panels represent different observers.

Contrast discrimination performance as a function of surround contrast. Arrow indicates the fixed 0.1 test contrast level (mean contrast for contrast discriminations). Different panels represent different observers.