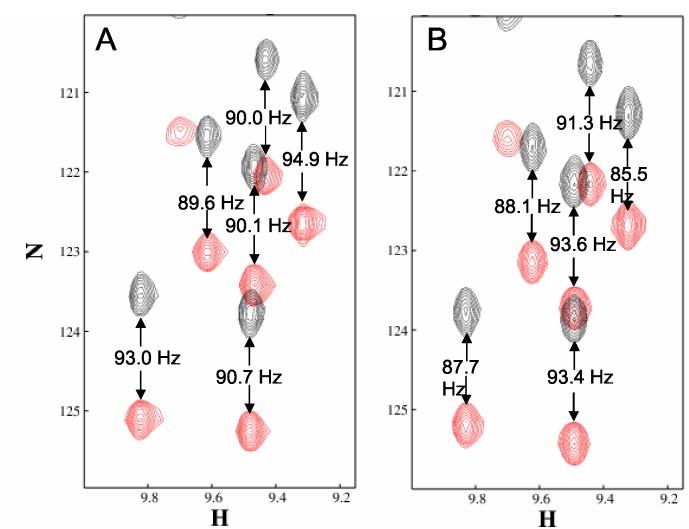
Figure 6.
IPAP-HSQC of PF0385 under isotropic (Panel A) and aligned (Panel B) conditions. The peaks corresponding to the sum and difference spectra are colored red and black, respectively. 15N-1H splittings are indicated. The isotropic sample contained 1 mM PF0385 in 20 mM sodium phosphate, 15 mM KCl, 90% H2O. The aligned sample contained 0.5 mM PF0385 in 20 mM sodium phosphate, 85 mM NaCl, 10 mg/mL Pf1 page, 90% H2O.

