
Figure 4.
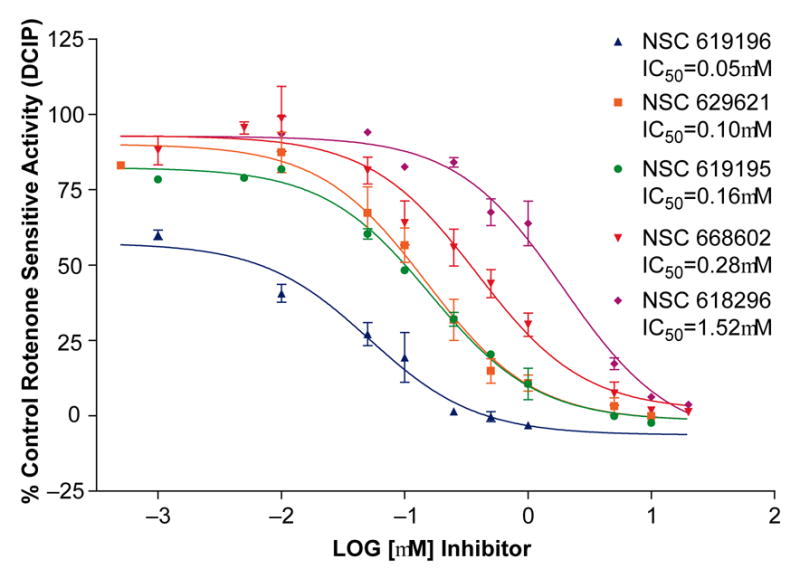
Dose response curves for the five strongest inhibitors discovered by the survey in Figure 1. Inhibitor concentrations for NSC 619196, 629621, 619195 and 668602, and 618296 ranged from an initial concentration of 20μM to 1nM final concentration in the complex I assay. Inhibitors were incubated with the SMP for at least two minutes prior to addition of NADH to initiate the assay , then NADH oxidation and DCIP reduction was monitored for several minutes and slopes at each concentration of inhibitor were used to calculate specific activities. The IC50's obtained by the dose -response curves for each compound were obtained by non-linear regression analysis, one-site competition, using GraphPad Prizm. The specific activity of complex I enzyme in the presence of the serial dilutions of the compounds was divided by maximal (total) rotenone sensitive specific activity (DMSO control DCIP activity-Rotenone control DCIP activity) to obtain calculations for % Control (n=3).