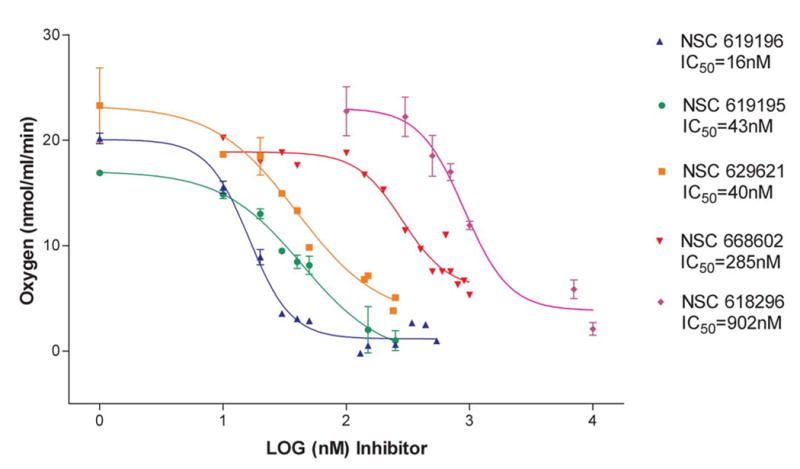
Figure 5.

Dose response curves for Complex I inhibition of K562 Cells by the five strongest inhibitors confirmed by Table I. Dose response curves are based upon the change in rate of oxygen consumption when increasing concentrations (range=1nM to 1mM) of inhibitors of Complex I are added, after 1x10⁷ cells have been permeabilized with digitonin and energized with Complex I substrates. The IC50's obtained by the dose -response curves for each compound were obtained by non-linear regression analysis, one-site competition, using GraphPad Prizm. n=2–4 separate experiments for each concentration.
