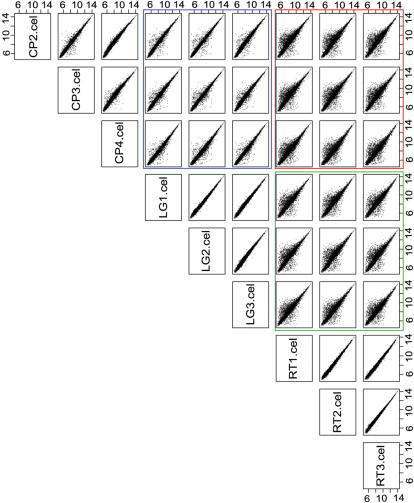
Figure 2. Pair-wise scatter plots for the raw PM probes intensity data across all arrays.
The intersection of 12000 randomly chosen features/probes data for CP and LG is boxed in blue, for CP and RT in red and for LG and RT in green respectively. The biological replicates of each variety are highly correlated as features are falling along diagonal line. CP = Cypress, LG = LaGrue, RT = RT0034 and PM = perfect match.

