Figure 6.
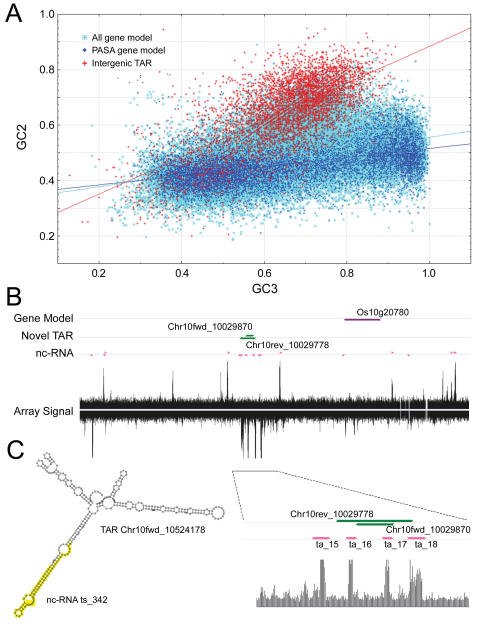
Analysis of non-coding intergenic TARs. (A) Scatterplot of GC2 versus GC3 in all gene models (n = 46,976), FL-cDNA-supported PASA gene models (n = 11,494), and intergenic TARs (n = 5256). The intergenic TARs were distal (>1Kb) to a gene model excluding those with a hit in the ProSite database. (B) Overlapping TARs with putative non-coding transcripts. A 5-Kb region represented by the high-resolution tiling array is shown. The interrogating probes are aligned to the chromosomal coordinates, with the fluorescence intensity value depicted as a vertical line. Gene models, no-exonic TARs and putative non-coding transcripts are depicted as horizontal arrows, which point to the direction of transcription. A portion of the region containing four non-coding transcripts and a pair of TARs is enlarged and shown at the bottom. (C) Predicted secondary structure of the TAR Chr10fwd_10524178. The sequence corresponding to the putative nc-RNA ts_342 is highlighted.

