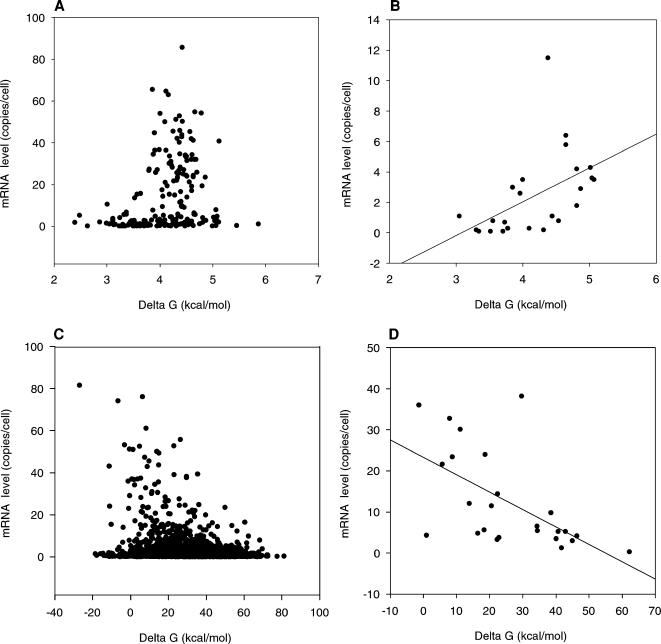
Figure 3.
Scatter plot, showing the relationship of mRNA level (copies per cell) and Δ G (kcal/mol) of EPR mRNA/DNA duplexes and Δ G avg of exon mRNA/DNA duplexes. (A) Relationship between mRNA level and Δ G avg of all coding sequences in intron containing ORFs. (B) Relationship between mRNA level and Δ G avg of coding sequences in intron containing ORFs longer than 2000 bp. (C) Relationship between mRNA level and Δ G for all available EPRs. (D) Relationship between mRNA level and ΔG of EPRs for genes shorter than 250 bp.

