
Figure 5.
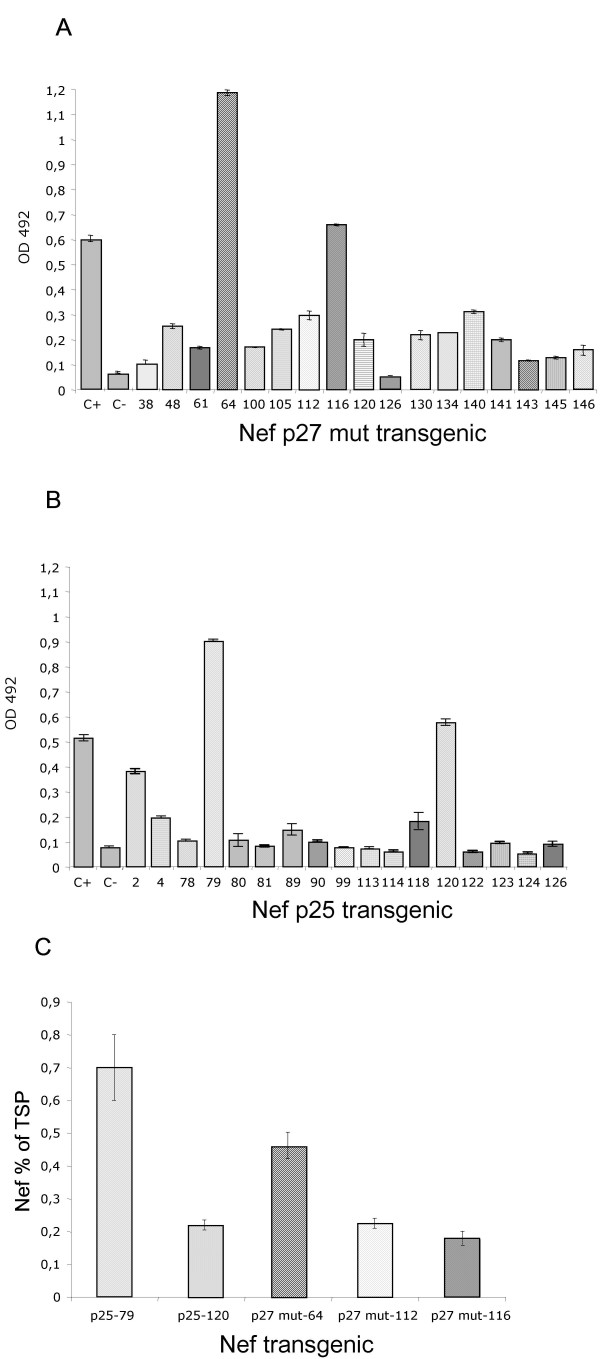
ELISA analysis of transgenic tobacco plants expressing cytosolic Nef. A:Representative ELISA assay of p27 mut Nef tobacco lines. C+: 100 ng of E.coli recombinant Nef; C-: control plant, untrasformed tobacco. The numbers on the x axis indicate individual transgenic tobacco lines. B:Representative ELISA assay of p25 Nef tobacco lines. C+: 100 ng of E.coli recombinant Nef; C-: control plant, untrasformed tobacco. The numbers on the x axis indicate individual transgenic tobacco lines. C: ELISA quantification of plant-expressed Nef variants. The Nef expression levels are expressed as percentage of total soluble protein (TSP) from transgenic plants. The values shown represent averages of two experiments. The numbers on the x axis indicate individual transgenic tobacco lines.