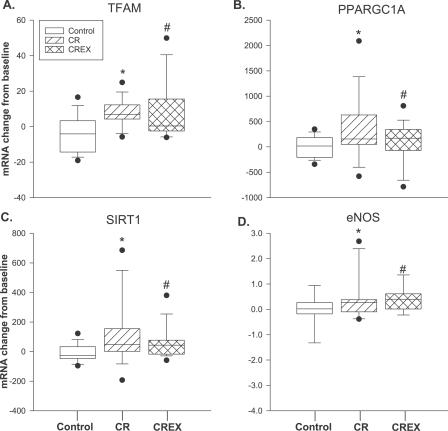
Figure 1. Changes in Skeletal Muscle Gene Expression for Key Mitochondrial Proteins.
(A) TFAM: *CR, p = 0.001; #CREX, p = 0.014.
(B) PPARGC1A: *CR, p = 0.004; #CREX, p = 0.002.
(C) SIRT1: *CR, p = 0.016; #CREX, p = 0.023.
(D) eNOS: *CR, p = 0.002; #CREX, p = 0.039.
Graphs show six-month changes in enzyme expression in response to each intervention. The y-axis represents the relative gene expression change from baseline for each study group. Each box plot shows the distribution of expression levels from 25th to 75th percentile, and the lines inside the boxes denote the medians. The whiskers denote the interval between the 10th and 90th percentiles. The filled circles mark the data points outside the 10th and 90th percentiles. Molecular analysis was performed in 11 of 12 volunteers per group from whom there was sufficient pre- and postintervention sample for this determination. Changes from baseline to month 6 were analyzed by analysis of variance with baseline values included as covariates.

