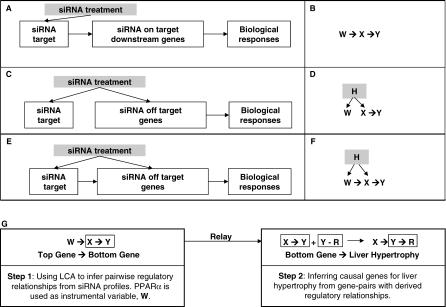
Figure 2. Schematic of the LCA That Determines Genes Mediating Certain Cellular Responses from Expression Profiles after Perturbation by siRNA.
The three major scenarios for the effect of siRNA on gene expression and biological response are illustrated in (A): the direct target or the on-target gene for siRNA and/or its downstream regulated genes resulting in a cellular response; (C): the off-target genes and their downstream regulated genes causing the cellular response; and (E): the cellular effect of an siRNA toward on-target and/or off-target genes and their downstream regulated genes leading to the cellular response. The corresponding causal models among the instrumental variable W, the top gene X, and the bottom gene or response Y for these scenarios are shown in (B,D,F). The hidden variable, H, is not measurable by expression profiles. The flow chart for two-step relay is illustrated in (G).

