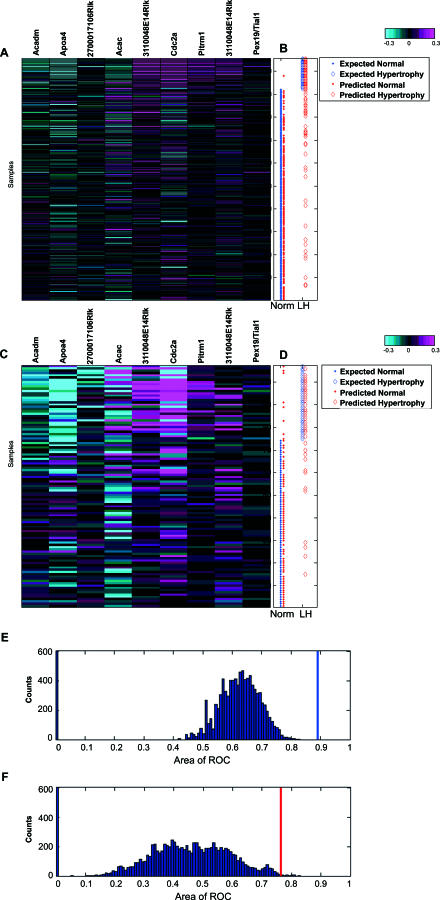
Figure 4. Predictability of Liver Hypertrophy Induced by Non-PPARα Compounds from Inferred PPARα–AILH Causal Genes.
Nine selected transcripts for the logistic regression model from the 16 inferred causal genes were coordinately regulated in the training set (A). A total of 211 expression profiles for the nine measured transcripts were aligned with liver hypertrophy, defined by the liver/body weight ratio (B) in corresponding rats (color bar: −0.3:0.3 at log10 scale). The expected normal liver and liver hypertrophy (LH), based on measured liver/body weight ratio in the training set, are indicated by blue dots and diamonds, respectively, while the predicted normal liver and LH derived from the established model are indicated by red dots and diamonds, respectively (B). Based on the logistic regression model built from the training set, the pathological condition of the liver in the independent testing set (normal or hypertrophy) was predicted (D). The expected normal liver and LH based on measured liver/body weight ratio in the testing set are illustrated by blue dots and diamonds, respectively. The predicted normal liver and LH derived from the established model from the training set are indicated by red dots and diamonds, respectively. Distinctive patterns of the selected biomarkers are evident between the normal and hypertrophic livers [(A,C); color bar: −0.3:0.3 at log10 scale]. The probability of obtaining such a set of predictive biomarkers from the genes correlated with the liver/body weight ratio in the PPAR minicompendium was significantly small in both the training dataset [(E), p < 0.001] and the testing dataset [(F), p < 0.005]. The AUCs for the ROC of the built model based on causal transcripts are indicated by the blue and red bars for the training and testing dataset, respectively, among the distribution of AUCs for 10,000 trials of 16 genes randomly selected from 757 genes correlated with the endpoint in the minicompendium (E,F).

