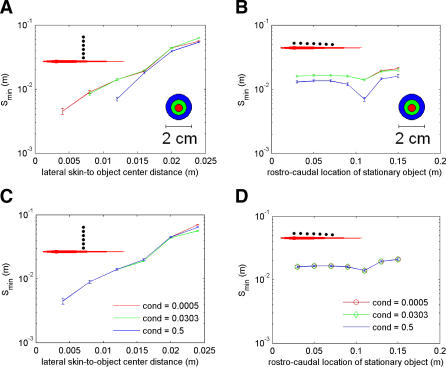
Figure 2. Effect of Object Location and Conductivity on Spatial Electroacuity.
In all panels, see fish insets for approximate lateral and rostro–caudal locations where Smin was calculated. Error bars represent the sampling that was used to calculate the Smin (either 0.5 or 1 mm). Lateral distance is measured as object center to fish skin (as in Figure 1).
(A) Effect of lateral distance on Smin for three distinct object diameters (rostro–caudal location, x = 0.11 m). Red, 0.3 cm (prey size); green, 1 cm; blue, 2 cm. Object conductivity fixed at 0.0303 S/m (prey conductivity).
(B) Effect of rostro–caudal position on Smin for same object sizes and conductivity as (A), with a lateral distance of 0.012 m.
(C) Effect of lateral distance on Smin for three distinct object conductivities (rostro–caudal location, x = 0.11m). Red, 0.0005 S/m (plant conductivity); green, 0.0303 S/m (prey conductivity); blue, 0.5 S/m. Object diameters fixed at 0.3 cm (prey size).
(D) Effect of rostro–caudal position on Smin for same object diameter and conductivities as in (C), with a lateral distance of 0.012 m.

