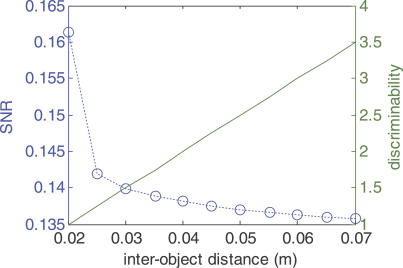
Figure 6. Prey Detectibility and Background Sparseness.
(Left axis, blue trace) SNR ratio between the prey and background transdermal potential time series and the background-only time series (i.e., between blue and green traces in Figure 5A; see Materials and Methods for more details). Each point represents the mean SNR of ten locations (over an ~0.01 m–wide patch of skin) centered 0.05 m caudal from the tip of the fish's head. SNR is shown as a function of interobject spacing of the background.
(Right axis, green trace) Theoretical discriminability (see Materials and Methods) between two background-type objects as a function of their spacing, using the same object size (2-cm diameter) and lateral distance (0.05 m) as in Figure 5.

