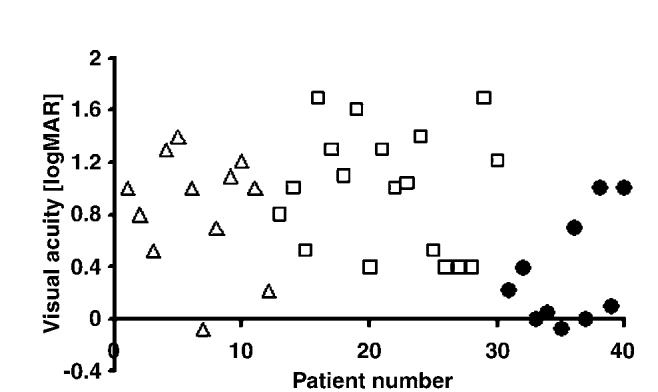
Figure 5.

Scatter plot showing the visual acuities of the patients grouped by their bowtie appearance. Note the large proportion of patients with good visual acuity in the regular bowtie group, although there is some overlap in VA of patients from groups. Consistently poor visual acuities occurred in the patients without a well-formed bowtie (squares), and largely poor visual acuities for the disrupted bowtie group (triangles). SquaresFno bowtie; trianglesFdisrupted bowtie; circlesFregular bowtie.
