
Figure 4.
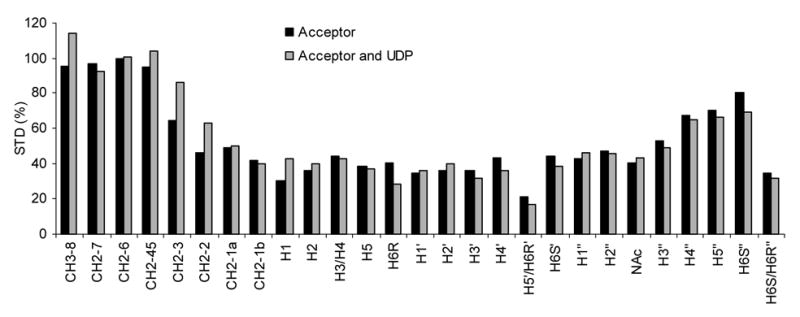
STD data for the acceptor plus GnT-V without (black) and with UDP (gray). Each set was normalized to 100% using the peak height of the acceptor octyl chain methylene signal (CH2-6). The STD patterns are similar for both conditions suggesting little conformational change around the acceptor binding pocket due to UDP binding.