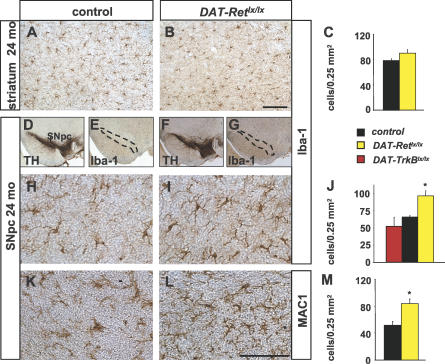
Figure 6. Inflammation in SNpc of DAT-Retlx/lx Mice.
(A, B, D–I, K, and L) Immunohistochemical stainings of dorsal striatum (A and B) and SNpc (D–I, K, and L) of 24-mo-old control (A, D, E, H, and K) and DAT-Retlx/lx mice (B, F, G, I, and L) for Iba-1 (A, B, E, G, H, and I), TH (D and F), and MAC1 (K and L). To localize microglial cells in SNpc, adjacent sections were stained for TH, and the area of the SNpc was marked and copied to the adjacent section stained for macrophages.
(C, J, and M) Histograms showing the number of Iba-1–positive (C and J) and MAC1-positive (M) cells in the striatum (C) and SNpc (J and M) of 24-mo-old (C and J) DAT-Retlx/lx mice and controls. No significant alterations in the numbers of Iba-1–positive cells were observed in the striatum of 24-mo-old mutants and controls ([C] n = 4, p = 0.065). A significant increase in the numbers of Iba-1–positive cells was observed in the SNpc of 24-mo-old DAT-Retlx/lx mice compared to controls (J) (n = 5, p < 0.05). The same result was obtained using MAC1 as a second independent microglial marker (M) (n = 3, p < 0.05). *, p < 0.05 (Student t-test). Scale bars indicate 100 μm.

