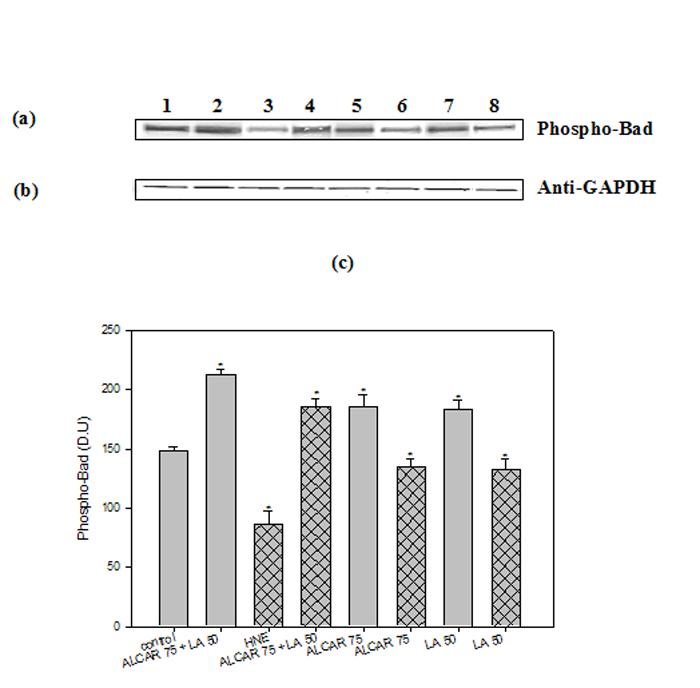
Fig. 11.

ALCAR and LA-mediated phosphorylation of Bad. The treatments to the samples and method followed were the same as in Fig. 9. Each experiment was repeated five times with independent samples. (a) Representative Western immunoblot analysis of neuronal cells for phospho-BAD (probed with mouse monoclonal anti-phospho-BAD antibody). (b) Anti-GAPDH blot as control for equal protein loading. (c) Densitometric analysis from five independent experiments (mean ±SD of values expressed as relative units). Significant differences were assessed by ANOVA. (n=5). Post hoc analysis was via Student-Newman-Keuls test, and the P values given are compared with the control. *p<0.005.
