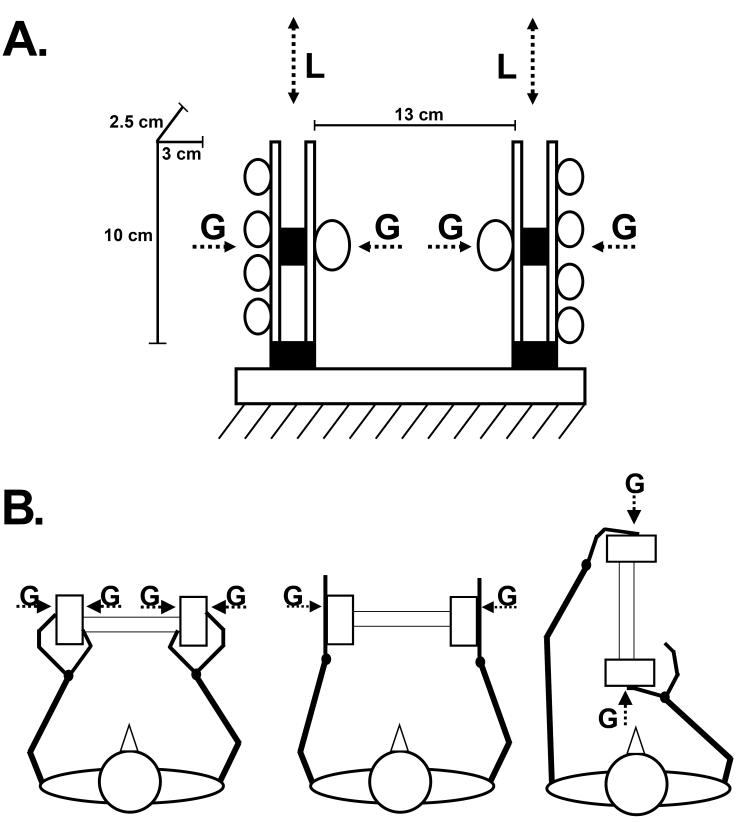
Fig. 1.
(A) Schematic representation of the experimental device. The circles illustrate the position of the tips of all five digits applying precision grasp against two handles. The lower shaded rectangles illustrate the force sensors recording the instructed load force (L) exerted in vertical direction, while the upper ones recorded the grip force (G). (B) The stick diagrams illustrate the horizontal projections of the applied precision grasp (left hand side; this grasp is also illustrated in Fig. 1A), palm-palm grasp (middle), and the fingers-thumb grasp (right hand side), as well as the corresponding G.

