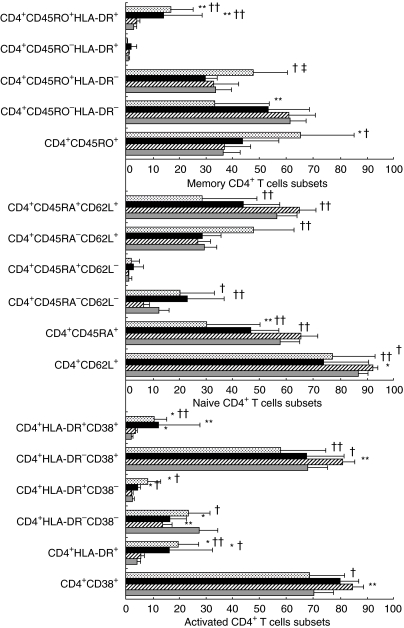
Fig. 2.
Summary of the mean percentage values of activated, memory and naive CD4+ T cell subsets stratified according to proliferative responses (see Statistics): (a) P1: children with a normal proliferative response to PWM; (b) P2: children with a lower proliferative response to PWM but normal cell proliferation to PHA; (c) P3: children with lower proliferative responses to both PWM and PHA. (*) Differences with control group (*P < 0·05; **P < 0·01). Differences with P1 (†P < 0·05; ††P < 0·01). Differences with P2 (‡‡P < 0·01).  , P3 = PWM and PHA lower than control; ▪, P2 = PWM lower than, and PHA similar to control;
  , P1 = PWM similar to control;
  , control non-HIV.

