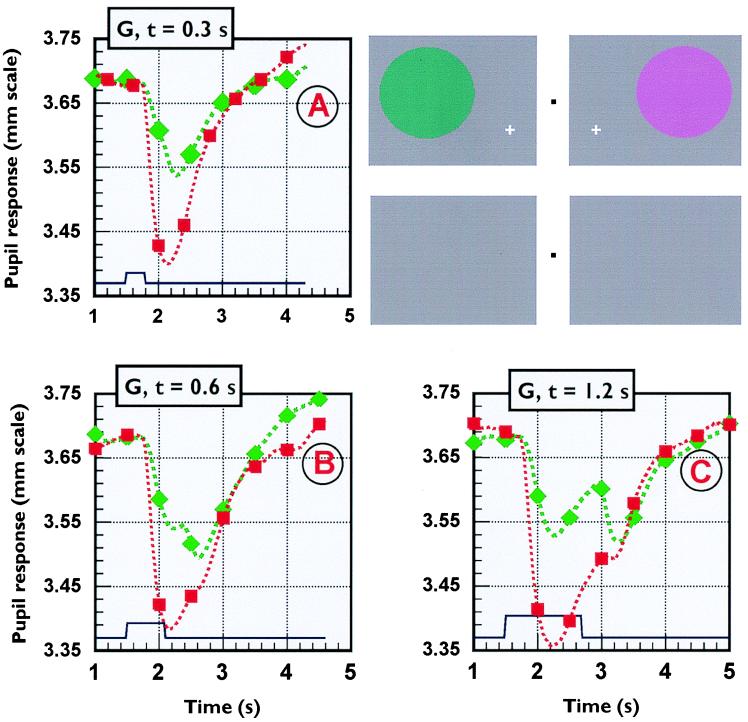
Figure 1.
Pupil responses to “red” and “green” stimuli generated in a white background field of luminance 12 cd/m2 and CIE (u′, v′)-chromaticity coordinates 0.179, 0.467 (see Inset). Each pupil response represents the average of 48 traces. In addition to the expected response to stimulus onset, the longer stimulus durations also show a response to stimulus offset that is particularly large for the “green” stimulus (C). The Inset on the top right hand side has been added to help the reader appreciate the subject’s perception of the stimulus and its chromatic afterimage during the test. To see these afterimages, place this figure at normal viewing distance in good illumination and look steadily for a few seconds at the upper black dot placed midway between the red and the green discs. Shift your gaze direction to the lower dot in between the uniform, gray fields and you should now again perceive the two colored discs, but with the red on the left and the green on the right. The red symbols show responses measured for a stimulus chromatic displacement 0.12 unit in the “red” direction, whereas the maximum chromatic saturation possible along the “green” direction was only 0.08 unit. The duration of the colored stimulus varied from 0.3 s to 1.2 s, as shown in each section. The results show that, for the longer stimulus durations, the d-isoluminant stimuli employed generate two constrictions of the pupil, with the second constriction amplitude being particularly large for the green stimulus. Comparable results were obtained in three normal subjects and in the sighted hemifield of the second hemianope (subject W).

