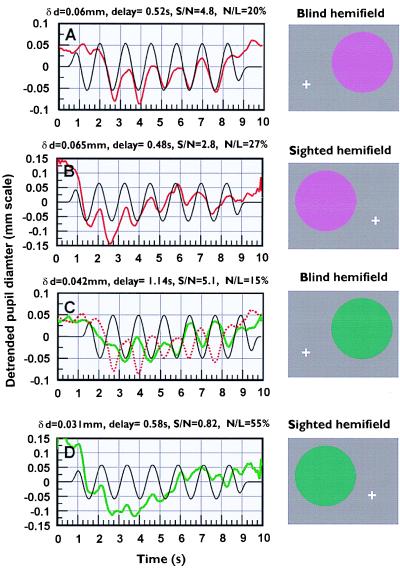
Figure 4.
Pupil responses to sinusoidal modulation of the same “red” and “green” stimuli presented to either the blind or the sighted hemifields in subject G as shown by the Panels on the right. The luminance of the background field was 24 cd/m2 and (u′, v′)-chromaticity coordinates 0.179, 0.467. The luminance of the background field remained unchanged throughout, and the colored stimuli were again d-isoluminant. The chromatic saturation of each stimulus was modulated sinusoidally at a frequency of 0.8 Hz. Each stimulus consisted of eight cycles of modulation with maximum chromatic saturation amplitude of 0.071 unit. The stimuli were interleaved, and 16 traces were averaged for each stimulus condition. The pupil modulation amplitude, δd, and phase shift at the modulation frequency, together with a measure of signal/noise ratio (S/N) and response nonlinearity (N/L) were then computed from the discrete Fourier transform of each averaged trace. These parameters, the measured, detrended pupil trace, and the corresponding reference waveform (phase-shifted to match the phase of the 0.8 Hz frequency component) are shown in each section. The results show that the pupil responds well to chromatic modulation toward the long-wavelength region of the spectrum locus for stimulus locations both in the sighted and the blind hemifields. Pupil responses to the green stimulus imaged in the sighted hemifield are heavily contaminated by a harmonic component at twice the modulation frequency that produces 55% nonlinearity (D). The dotted red trace in C shows the blind hemifield response to “red” modulation taken from A. Comparison of the two traces confirms the 180° phase shift between red and green responses as predicted by the afterimage model shown in Fig. 3C.

