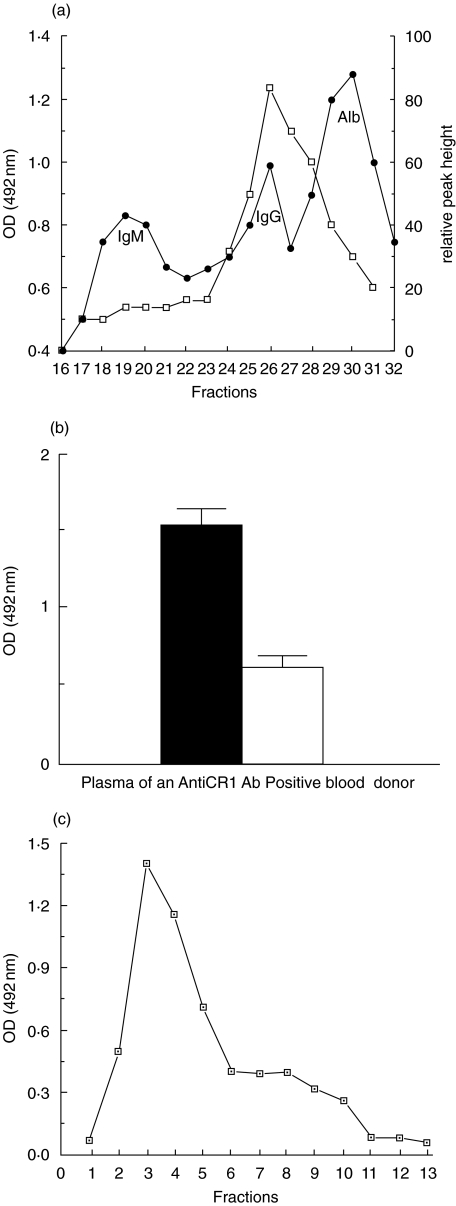
Fig. 3.
Gel filtration and affinity chromatography of antiCR1 positive plasma (a) The fractions positive for antiCR1 corresponded to the expected position of IgG (fractions 25–27) of the FPLC profile. The left vertical axis indicates the OD of the signal of these fractions after being applied to the antiCR1 ELISA (□). The right vertical axis indicates protein concentration (•). (b) Plasma after versus before affinity chromatography on rCR1 showed depletion of antiCR1 autoAb. The sample volume applied was corrected for dilution. (c) AntiCR1 autoAb were recovered in the acid eluate (fractions 3–5).

