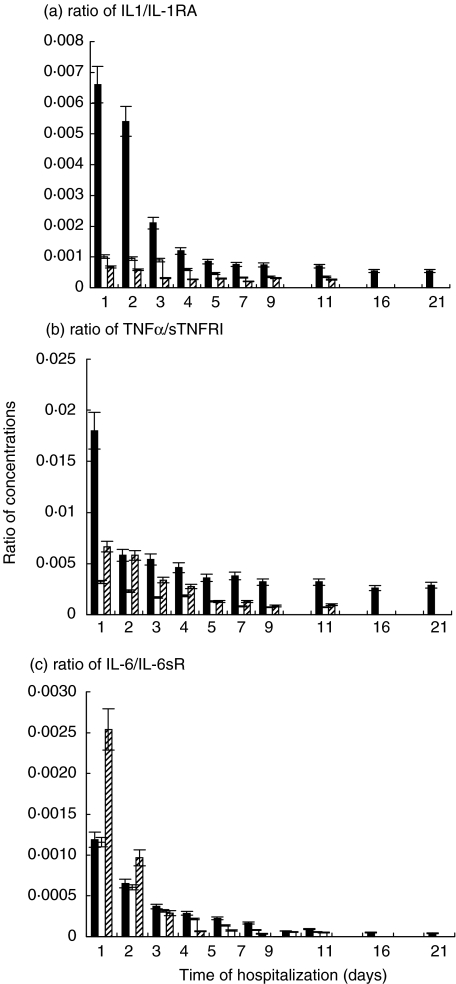
Fig. 2.
Ratios of certain cytokines to their receptors in serum of humans with TBE virus infection. ▪ group 1, □ group 2,  group 3. a, Ratio of IL-1/IL-1RA; b, Ratio of TNF-α/sTNFRI; c, IL-6/IL-6sR. All calculated ratios of group 1 are shown by day 21, as the hospitalization period in that group was longer in comparison with that in the groups 2 and 3. Data are mean ± SD.

